
Views and dashboards overview

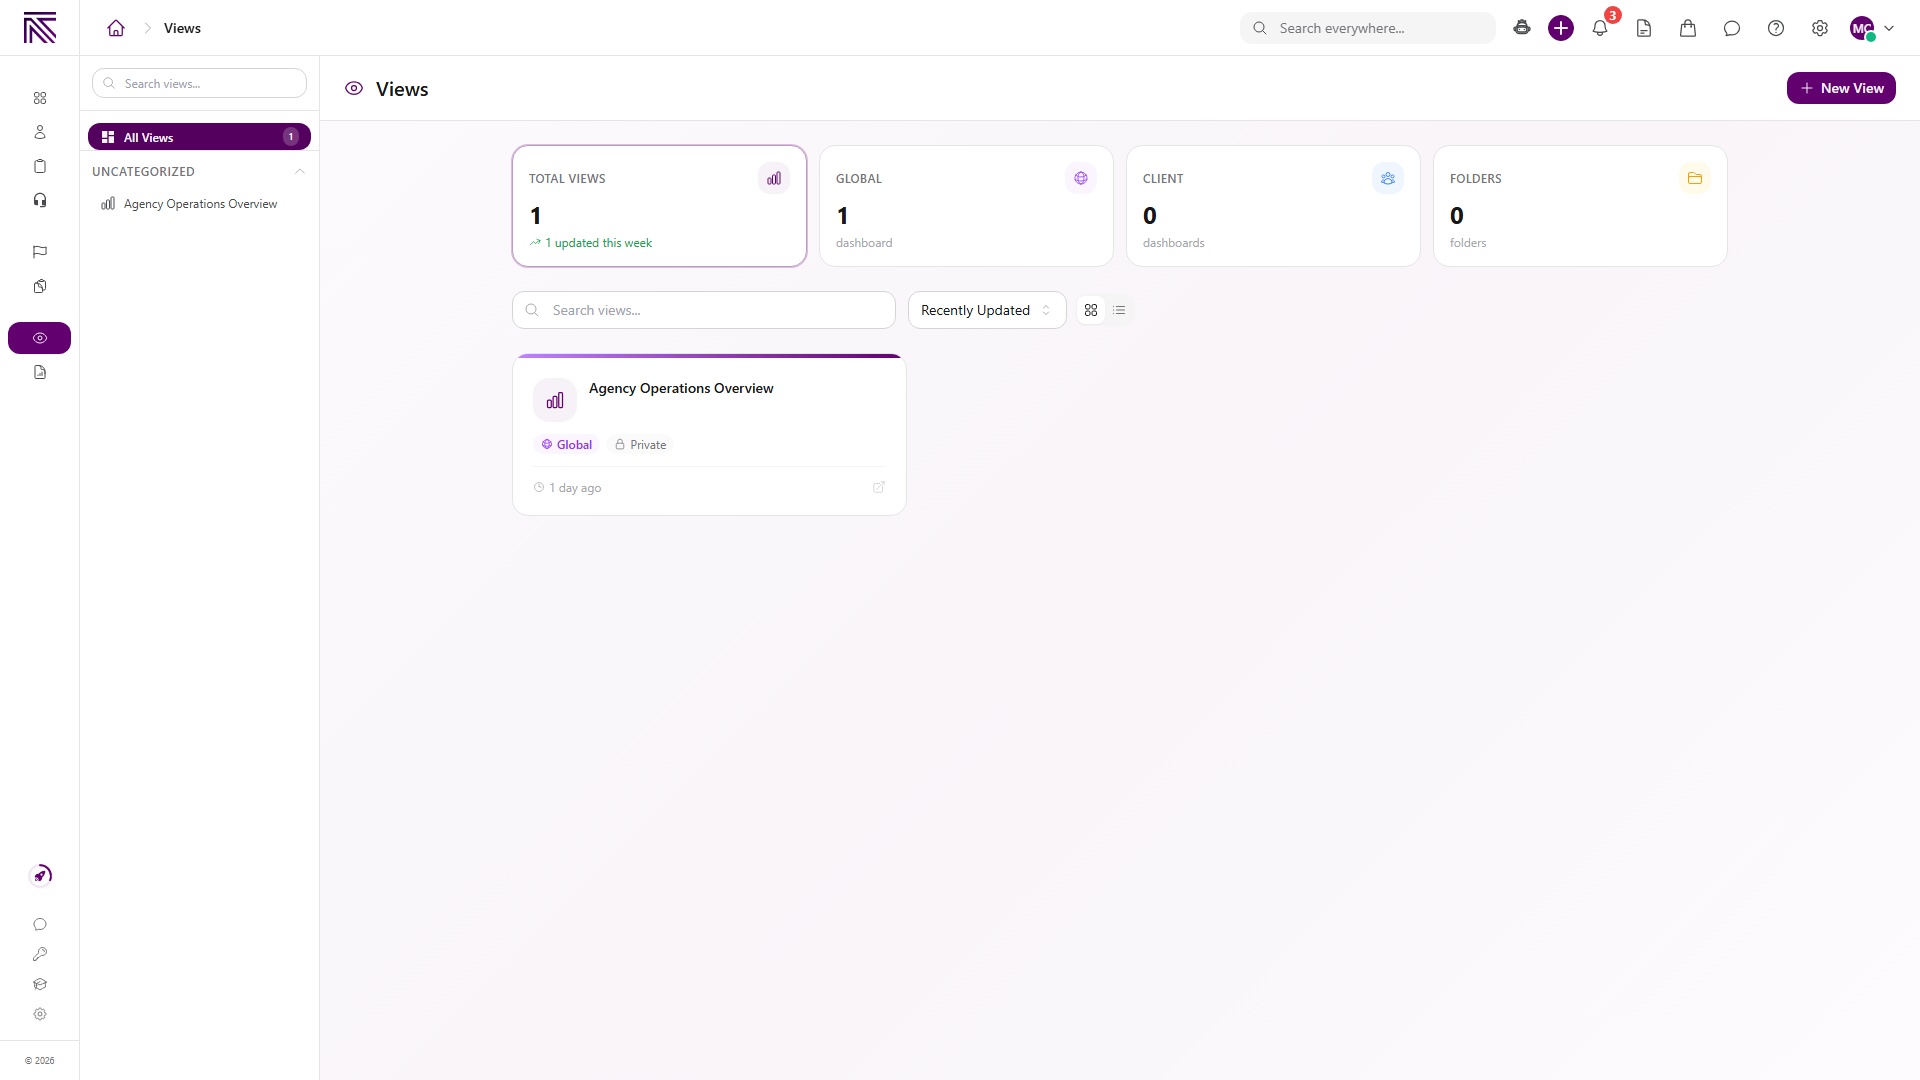
A view is a configurable dashboard or work surface. It has a layout made of sections and data blocks, plus settings for scope, visibility, date filtering, and refresh behavior. A view is more than a saved filter: filters and sorting belong to the individual data blocks inside it.
Who this is for
Section titled “Who this is for”Agency team members who open or design dashboards and work lists. Opening Views requires View Layouts. Creating or changing a view requires Create Layouts or Edit Layouts.
Where views appear
Section titled “Where views appear”- Views ( /views (opens in new tab) ) is the team-facing library. Use its sidebar, search, sort, folders, and Global or Client badges to find a published view.
- A client record has a Views tab for views that are available in client context.
- Views in agency settings ( /settings/views (opens in new tab) ) is where global views are created and edited.
- Client Views ( /settings/clients/views (opens in new tab) ) holds reusable client-scoped views.
- A process’s Views settings hold dashboards tied to that process definition.
View scopes
Section titled “View scopes”| Scope | Use it for | Where to create it |
|---|---|---|
| Global | Agency-wide reporting or work lists that can use data across the agency | Settings, then Views |
| Client | A reusable dashboard shown in client context | Client Views settings |
| Process | Reporting or work tracking tied to one process definition | Open the process in process settings, then select Views |
The selected scope organizes the view and controls its context. Each data block still has its own Data Source setting.
Data blocks available in the builder
Section titled “Data blocks available in the builder”| Block | What it shows |
|---|---|
| Data Table | Records in columns, with pagination, sorting, filters, and optional row actions. |
| Kanban Board | Records grouped into columns by a field such as current stage. |
| Calendar | Selected date fields on Month, Week, or Day views. |
| Charts | Bar, line, pie, donut, area, or scatter visualizations. |
| Metrics | Count, sum, average, percentage, or custom summary values. |
Combine blocks in one layout. For example, put metrics at the top, a chart beneath them, and a filtered table or Kanban board below for the records behind the summary.
Guides in this category
Section titled “Guides in this category” How-to Create a view Choose the view's scope, add a section, and configure the first data block.
  How-to Filter and sort view data Build per-widget conditions, sorting, limits, and date filtering.
  How-to Configure Kanban and calendar views Group records into Kanban columns or place selected date fields on a calendar.
  How-to Configure charts and metrics Build visual breakdowns and summary values for a dashboard.
  How-to Manage views Rename, duplicate, organize, change visibility, or delete a view.
 Related articles
 Concept Core Concepts Learn the AgencyTitan product model: workspace, clients, tasks, tickets, escalations, chat, SOPs, training, views, automations, programs, and settings.
  Concept Tasks & processes overview Understand how task types, process definitions, stages, fields, layouts, assignments, and tasks fit together.
  Concept Tickets overview How the Tickets inbox, ticket conversations, assignment, statuses, inboxes, routing rules, and reply templates fit together.
  Concept Settings overview Find AgencyTitan settings and understand how agency, ticket, process, notification, and personal controls fit together.